 Hepmade
  IOT solutions and Systems
  Automation
  Digital Mobility
  Sports & Hospitality
Distributed Tracing: The Magic wand to debug applications in Distributed System

In today’s world of modern application development, microservices have become the backbone of scalable, efficient, and maintainable systems. By breaking down large, monolithic applications into smaller, specialized services, organizations can build applications that are more resilient and easier to scale. However, this architecture introduces a significant challenge: observability. In a distributed environment with numerous microservices communicating across multiple nodes, tracing the flow of a single request becomes complex. When an unwarranted issue arises—whether it’s a latency spike, an error, or unexpected behavior—it can be exceptionally difficult to pinpoint the source of the problem. Is it an upstream service, a downstream dependency, a specific node, or an external factor? The lack of visibility into how requests traverse through these interconnected services makes debugging a tedious and time-consuming process, often leading to prolonged downtime and frustrated teams. This is the crux of the problem that distributed tracing and tools like OpenTelemetry aim to solve.
So, What is Distributed Tracing?
Distributed tracing is a method of observing and tracking the flow of requests as they move through the various components of a distributed system. It provides end-to-end visibility into the lifecycle of a request by capturing data about each service it interacts with, the time spent in each component, and any errors encountered along the way. Distributed tracing solves the challenge of debugging in complex microservices architectures by creating a trace—a detailed map that shows how a request flows from the client through multiple services and back. Each interaction is tagged with unique identifiers that correlate the request across services, making it possible to identify performance bottlenecks, failures, and root causes with precision. By visualizing these traces, developers and operators can pinpoint issues such as slow database queries, failing API calls, or overburdened nodes, dramatically reducing the time it takes to troubleshoot and resolve problems in a distributed environment.
There are several tools available for distributed tracing, including Jaeger, Zipkin, and OpenTelemetry. Among these, OpenTelemetry has emerged as the most popular, thanks to its open-source nature, vendor-neutral approach, and broad community support.

Now, let’s jump into how we can integrate OpenTelemetry with existing .NET Core based projects.
To integrate OpenTelemetry into a .NET Core application, follow these steps:
- Install Required NuGet Packages: Add the necessary OpenTelemetry NuGet packages, such as OpenTelemetry.Extensions.Hosting and specific instrumentation packages (e.g., OpenTelemetry.Instrumentation.AspNetCore or OpenTelemetry.Instrumentation.Http).
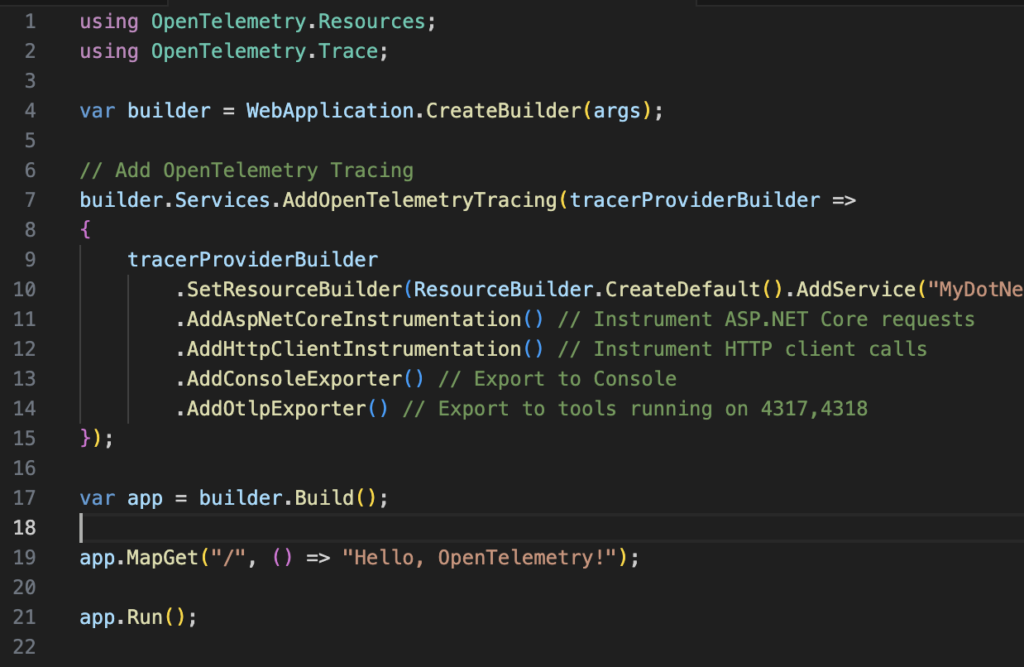
- Configure OpenTelemetry in Program.cs: In the Program.cs file, configure OpenTelemetry in the HostBuilder using AddOpenTelemetryTracing. Set up the TracerProvider to include instrumentation for relevant libraries (e.g., ASP.NET Core, HttpClient, etc.).
By following these steps, you can seamlessly integrate OpenTelemetry into your .NET Core application for distributed tracing.
using OpenTelemetry.Resources;
using OpenTelemetry.Trace;
var builder = WebApplication.CreateBuilder(args);
// Add OpenTelemetry Tracing
builder.Services.AddOpenTelemetryTracing(tracerProviderBuilder =>
{
tracerProviderBuilder
.SetResourceBuilder(ResourceBuilder.CreateDefault().AddService(“MyDotNetApp”))
.AddAspNetCoreInstrumentation() // Instrument ASP.NET Core requests
.AddHttpClientInstrumentation() // Instrument HTTP client calls
.AddSqlClientInstrumentation() // Instrument SQL calls
.AddJaegerExporter(jaegerOptions =>
{
jaegerOptions.AgentHost = “localhost”; // Jaeger agent host
jaegerOptions.AgentPort = 6831; // Jaeger agent port
});
});
var app = builder.Build();
app.MapGet(“/”, () => “Hello, OpenTelemetry!”);
app.Run();
Aftet that can download Jaegar from https://www.jaegertracing.io/ and install Jaegar locally. Once you are done with installation, navigate to http://localhost:16686 to access Jaegar UI. There you can see all instrumentation metrics data for your app.
You May Also Like

September 10, 2025
Nano Banana Trend: Create Free 3D AI Figurines

October 3, 2025
Voice Search Optimization 2025: Complete Guide to Rank Higher

June 22, 2024
Revolutionizing Industries: How Serverless Microservices Offer Efficient Solutions Across Sectors
Read More
Don't miss Our Update. Subscribe us for more info.
Request Quote
What type of solution you are seeking?
Please Select One
Your estimated budget
Please Select One